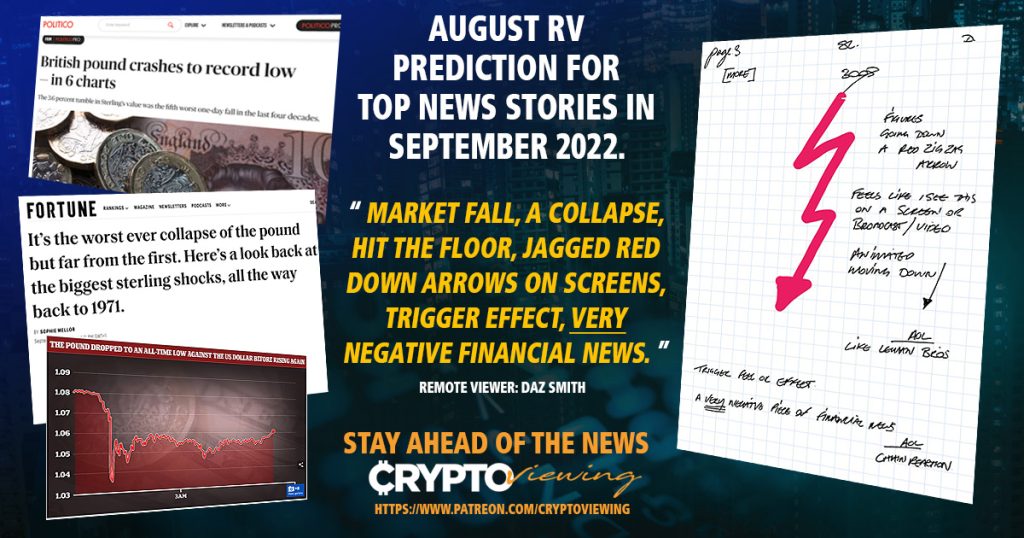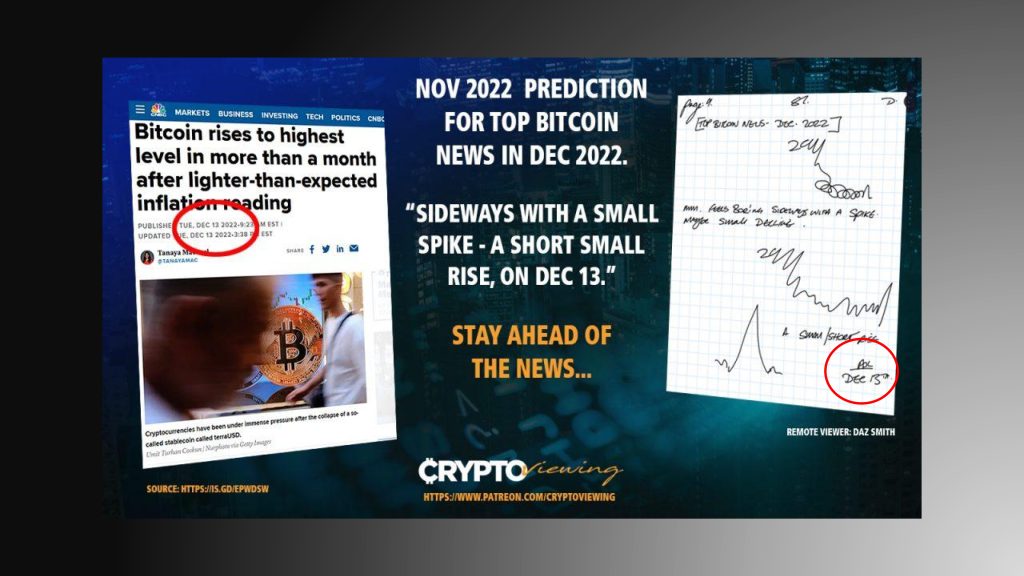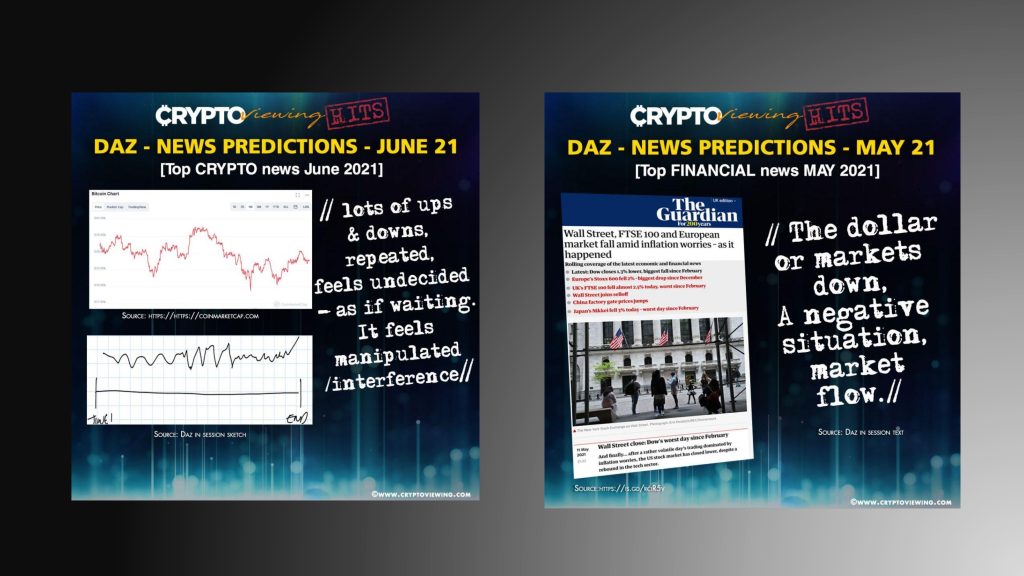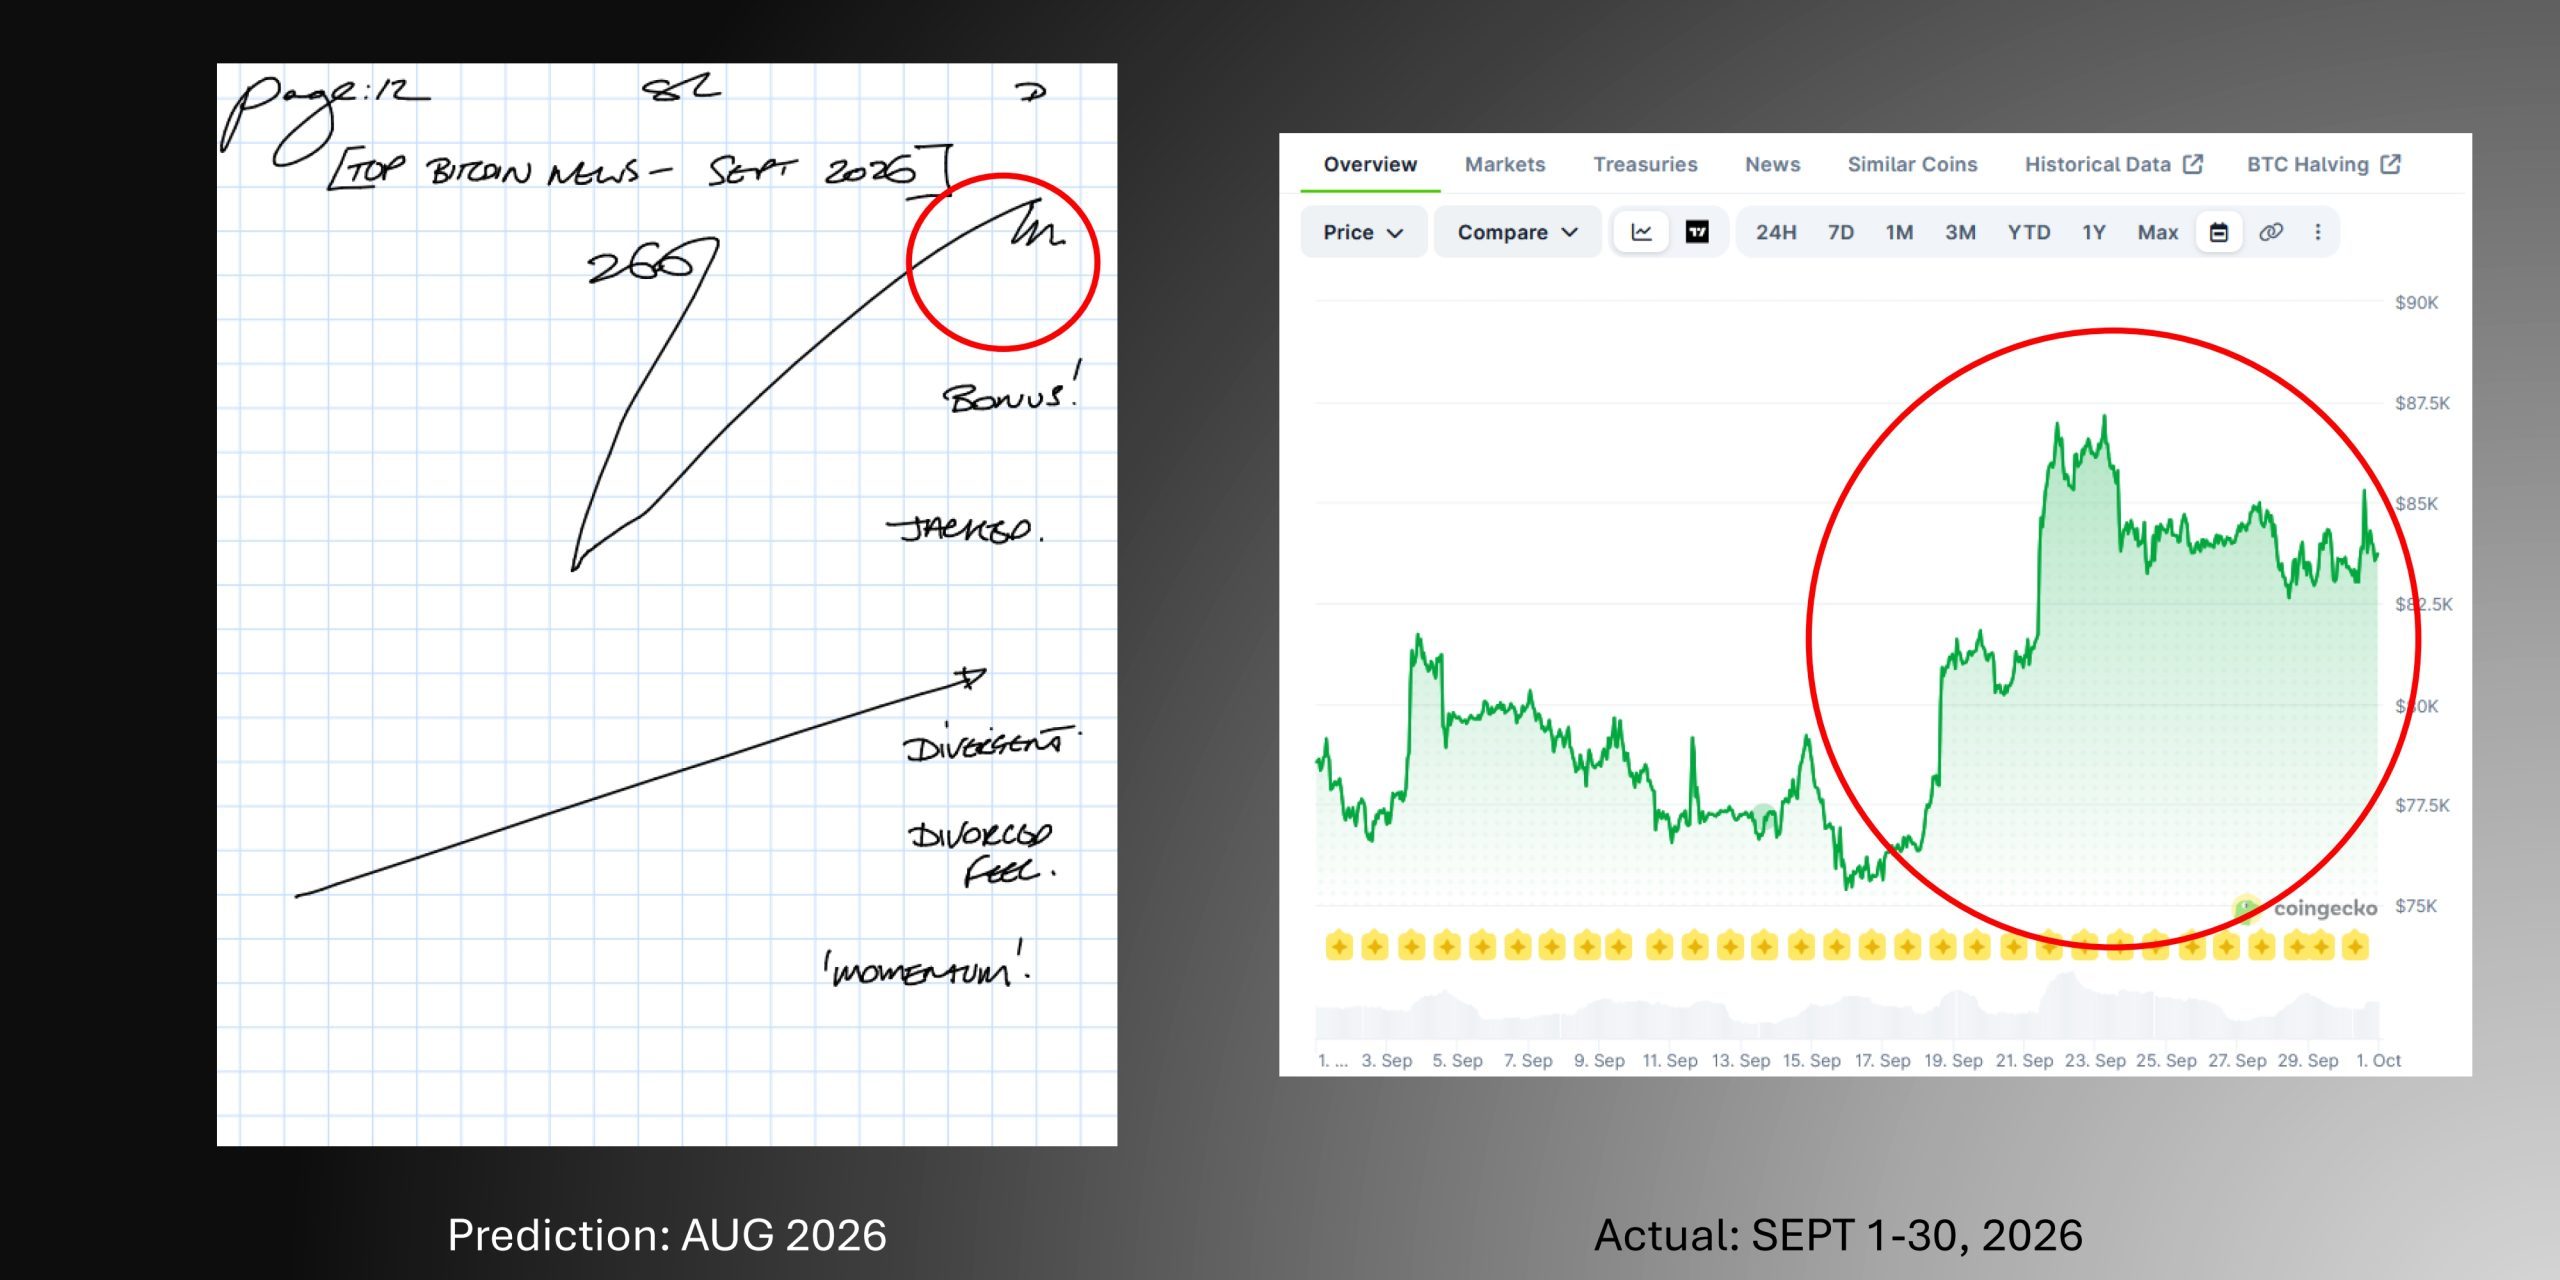
For those wondering whether — and how — Remote Viewing can have practical, real-world applications, I enclose a link to a quick presentation. These slides show my monthly Bitcoin ideogram FLOWs for 2026 so far, each produced approximately one month in advance.
What I find particularly interesting is the emergence of visual patterns within the ideograms that appear to correlate with Bitcoin’s subsequent price movement. The rises, falls, peaks and changes in momentum can sometimes be seen within the natural FLOW and shape of the ideogram itself.
This work forms part of a nine-year project at the Future Forecasting Group, where we have been exploring Bitcoin every month. For me, it provides another layer of information that I can consider alongside conventional research when making my own personal investment decisions.
It also demonstrates something I strongly encourage in my FLOW Remote Viewing students: don’t restrict the ideogram to simply identifying basic target gestalts.
When allowed to develop naturally with the individual viewer, the ideogram can become a surprisingly flexible and creative information tool.
Explore it. Experiment with it. Let it FLOW.
The Presentation shows;
- several crypto examples,
- Bitcoin predictions 2026,
- legacy predictions with feedback.
https://drive.google.com/file/d/1inBfb10Mn3NTPkGP5BMUb2ZcmVjOF_QN/view?usp=sharing